
Why we draw in data to evolve collective dreams
With the invention of her coxcomb diagram—the Rose Diagram—Florence Nightingale took data visualization to revolutionary heights. Not because the chart was visually pleasing, but because it anchored mathematics with meaning.

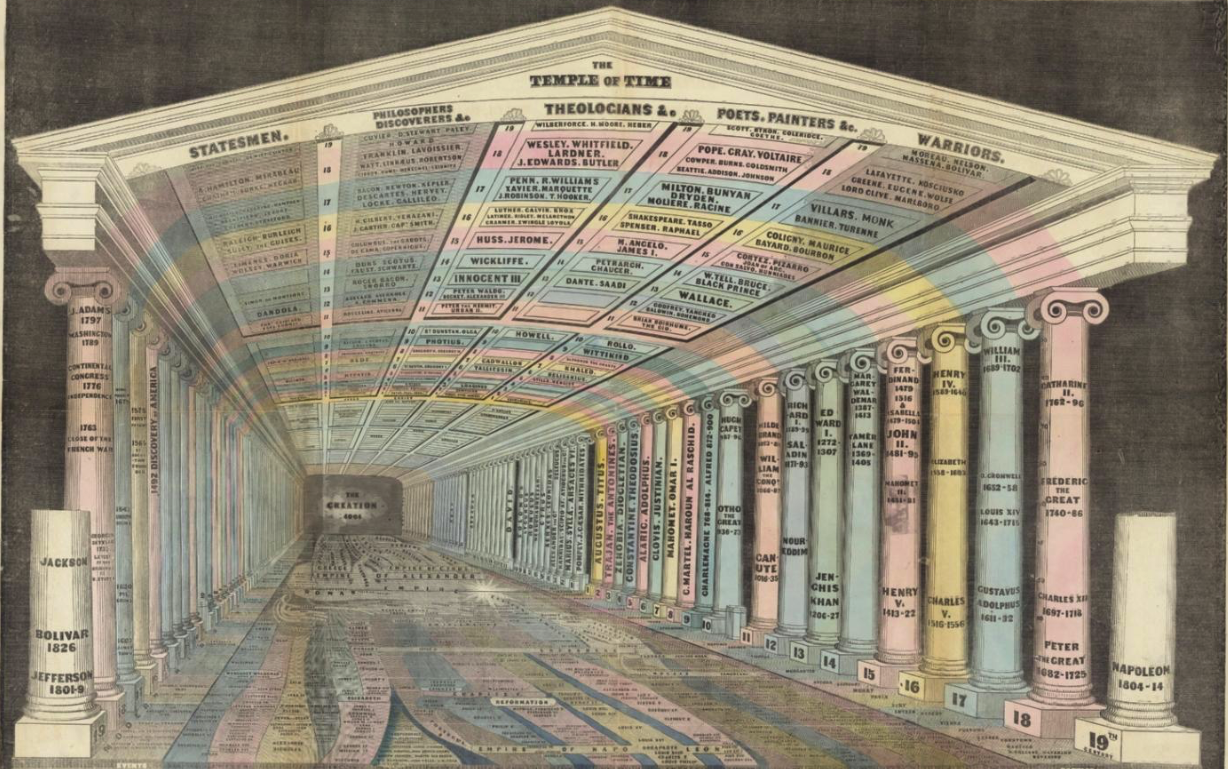
You can’t dip a brush into data, but you can draw with it. Cluttered by both quantitative and qualitative metrics, the world is now tangled in facts and figures that can be tricky to interpret. Such obscurity is significant when “data driven insights” anchor decisions that impact us all. Ambiguity need not be the norm, however, when we merge mathematics with art.
“Information can tell us everything. It has all the answers. But they are answers to questions we have not asked, and which doubtless don't even arise,” Jean Baudrillard once wrote.1 Visualizing data helps us to curate statistics not to tell us everything, but to reveal the somethings that we do seek to understand. Metrics are not material, but they can be made into an artistic medium.
Empowering ourselves with patterns
“I am of certain convinced that the greatest heroes are those who do their duty in the daily grind of domestic affairs whilst the world whirls as a maddening dreidel,” Florence Nightingale once said.2 She was also convinced of the importance of data visualization, a technique she employed to ensure that all people were able to interpret insights extrapolated from statistical analyses.
As psychologist Michael Friendly explains, visualization allows viewers to “see patterns, trends or anomalies, constancy or variation, in ways that other forms—text and tables—do not allow.”3 Humans have been charting data for a long time, but Nightingale’s reasons for doing so help us to understand the essentiality of presenting information with lines and dots, and in shapes and colours. She didn’t want to share stats; she wanted to tell a story.
“Nightingale’s innovation was less about technique than about her purpose,” Livia Gershon writes.4 While overseeing nurses in Turkey during the Crimean War in 1854, she was “horrified by unsanitary conditions and a lack of medical supplies.” Soon after, she began a campaign to improve conditions. “To win support for her efforts from England, she arranged the information she found using line graphs, scatterplots, and other graphic devices.” Adding colour strategically to draw the eye to particular data points, Nightingale knew how to emphasis the information needed to answer questions that mattered to the people. Today, those of us who are horrified by the harms of unconsciously designed technologies may win support for our efforts to alter the trajectory of tech via similar visualization methods.
Mapping meaning behind the mathematics
With the invention of her coxcomb diagram—AKA the Rose Diagram—Nightingale took data visualization to revolutionary heights. Not because the chart was visually pleasing, but because it anchored mathematics with meaning.
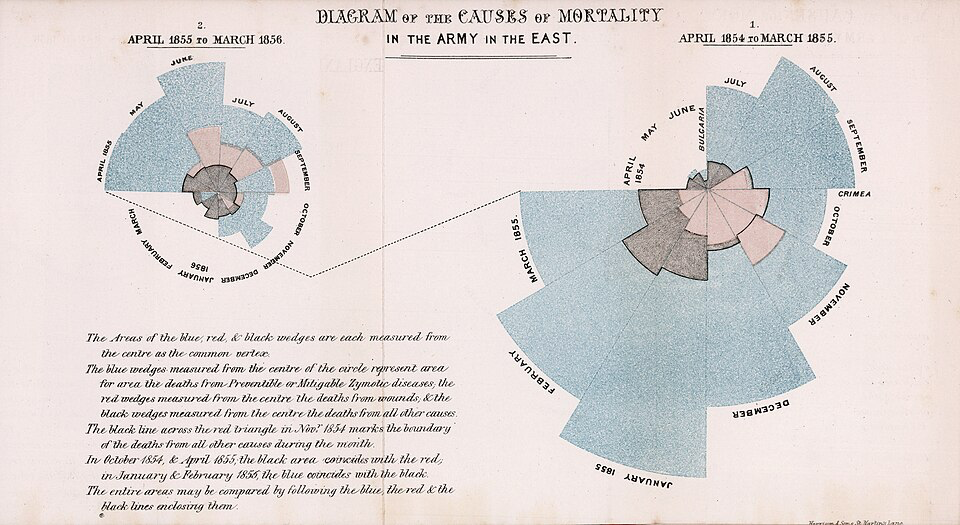
Designed in 1858, the first Rose Diagram visually represented monthly mortality rates in military hospitals. Via shape and colour, Nightingale differentiated between deaths caused by preventable diseases (blue), battle wounds (orange), and other causes (black). Diagrammatic wedges weren’t simply shapes, they were representations of lives lost that could have been saved.
“Nightingale’s Rose Diagram wasn’t just about science—it was a political tool,” Cat Wang and Paige Boklaschuk write.5 “By presenting data in a visually compelling way, she cut through bureaucratic resistance and made an undeniable case for reforms.” Her original coxcomb mapped mortality rates; modern coxcombs can map the psychosocial impacts of tech. Open dialogue on the human consequences of unconscious, non-participatory technological progress is essential, but so too is data visualization. When metrics on how lives are affected by existing tech can be seen—to be believed—we can make stronger cases for why future infrastructures ought to be designed differently. So that tech may meet the interests of the many, as opposed to the few.
Giving heart to hard facts
Nightingale was convinced that the greatest heroes are those who do their duty in the daily grind. These are the heroes whose voices must be heard for us to make participatory tech futures more probable together.6 For us to meaningfully dialogue on the direction of tech development, we must first have access not only to information, but also knowledge. Not just to messes of metrics, but also to readily digestible data visualizations. Such assets, like Nightingale’s Rose, give heart to hard facts by assisting us with the absorption of analytics through the lens of art.
“We are no longer in the era of virtue, but of virtuality,” Baudrillard believed.1 “We are no longer in the era of power, but of potentiality.” By embracing the practice of giving striking shape to statistics, we can deepen the (positive) punctures made by alternate and liberating points of view. Just as mathematician Anatolii Fomenko illustrated what he called a “strange, powerful and fantastic mathematical world” once upon a time,7 we too can dream up futures in art and data. This era of potentiality will be punctuated not by the oppressive forces of big tech, but by the fortitude of heroes and heroines who colour in new horizons.
References
- Cool Memories IV by Jean Baudrillard, 1990
- Character: Life Lessons in Courage, Integrity, and Leadership by Robert L. Dilenschneider, 2025
- 'The Golden Age of Statistical Graphics' by Michael Friendly
- 'Florence Nightingale, Data Visualization Visionary' by Livia Gershon
- 'How Florence Nightingale Used Data Visualization to Save Lives' by Cat Wang and Paige Boklaschuk
- 'Making Participatory Tech Futures More Probable Together' by Ismael Kherroubi Garcia, Mary Lang, Rasa Bocyte, and Kathryn Carter
- 'Soviet Artist and Mathematician Anatolii Fomenko’s Mathematical Impressions' by Maria Popova